“I love having real-time access to my students' performance data and knowing exactly what concepts have or haven’t been understood while they complete their IRATs and TRATs! InteDashboard has significantly enhanced the ease and effectiveness with which I prepare for, and teach in, my TBL classes at Deakin,” said Dr. Judy Currey, Professor at Deakin University.
InteDashboard empowers instructors with real-time data on students' and teams' performance, enabling quick interventions and ultimately leading to improved learning outcomes. As Professor Currey attests, with InteDashboard's real-time data insights, she gains immediate visibility into her students' progress, allowing her to make timely adjustments to her teaching approach and provide targeted support when needed.
In this blog post, we will delve into several key features of InteDashboard that support real-time data during the Individual Readiness Assurance Tests (IRAT), Team Readiness Assurance Tests (TRAT), and Application questions.
Confidence-based Testing
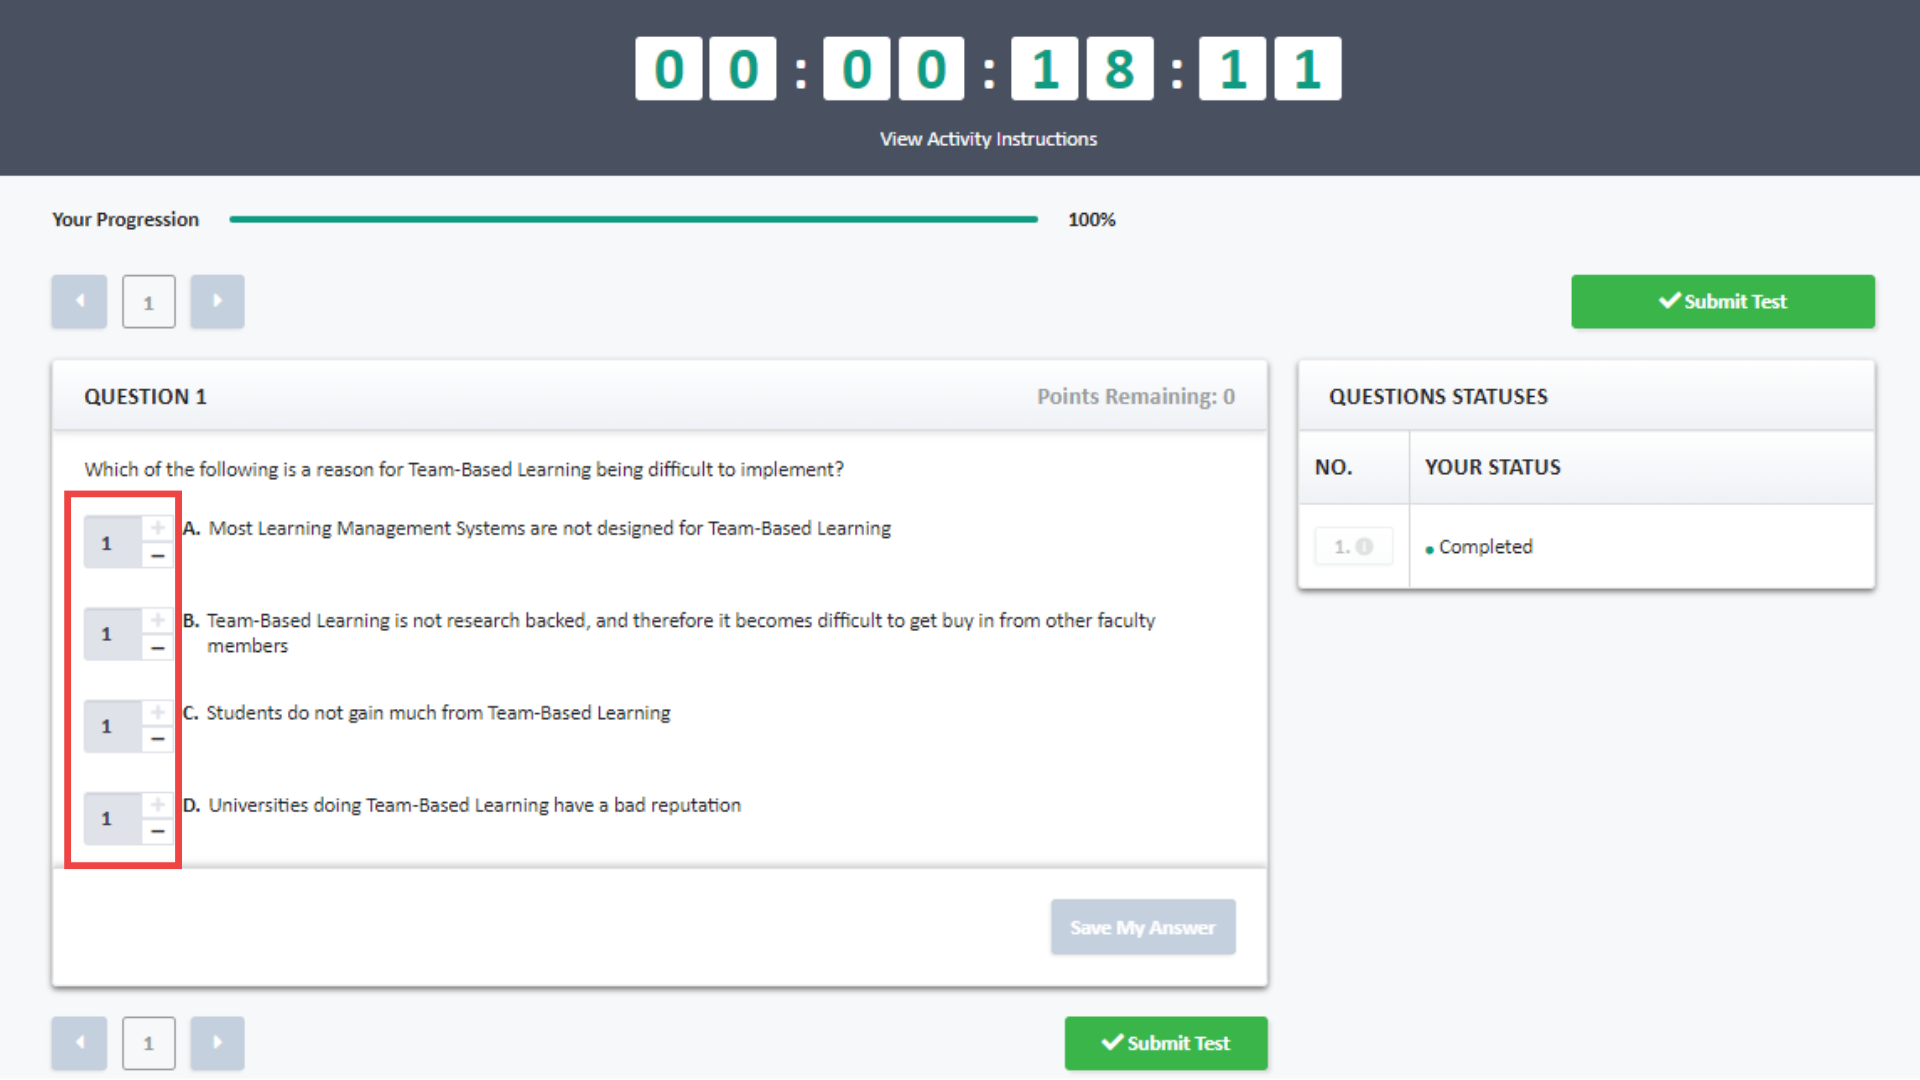
Student view of IRAT (Confidence-based Testing)
Confidence-based testing approach allows students to indicate their confidence level in their answers during the IRAT. This method enables instructors to evaluate not only the correctness of responses, but also the students’ confidence in their knowledge. By considering confidence levels, instructors can gain deeper insights into student understanding, assess question difficulty, and refine test quality.
Students’ answers are visible on the teacher dashboard in real-time:
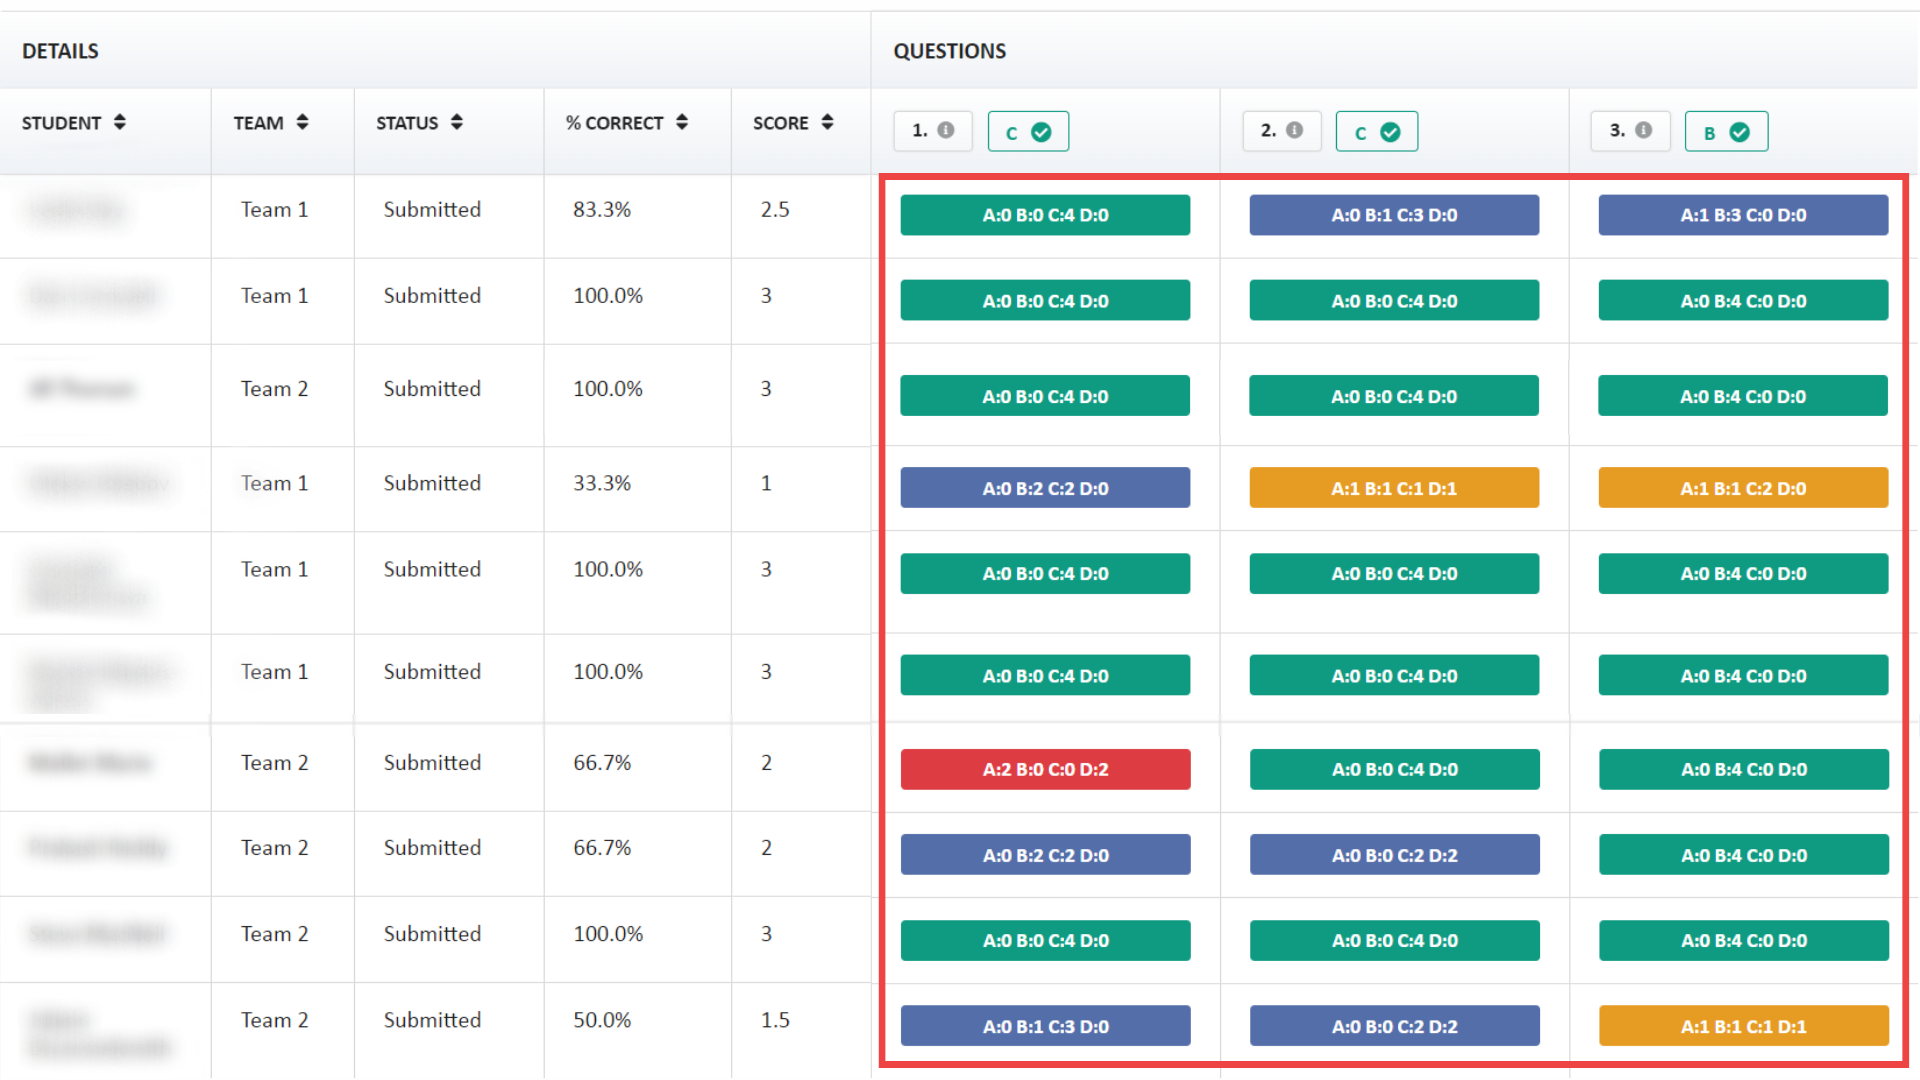
Teacher view of students’ IRAT (Confidence-based Testing) performance
Item Analysis
Item analysis is a statistical technique used to evaluate the effectiveness of individual test items or questions in an assessment. It provides valuable information about the quality, difficulty, and discriminatory power of each question, helping educators fine-tune their tests and improve the overall assessment process.
- Fail Rate
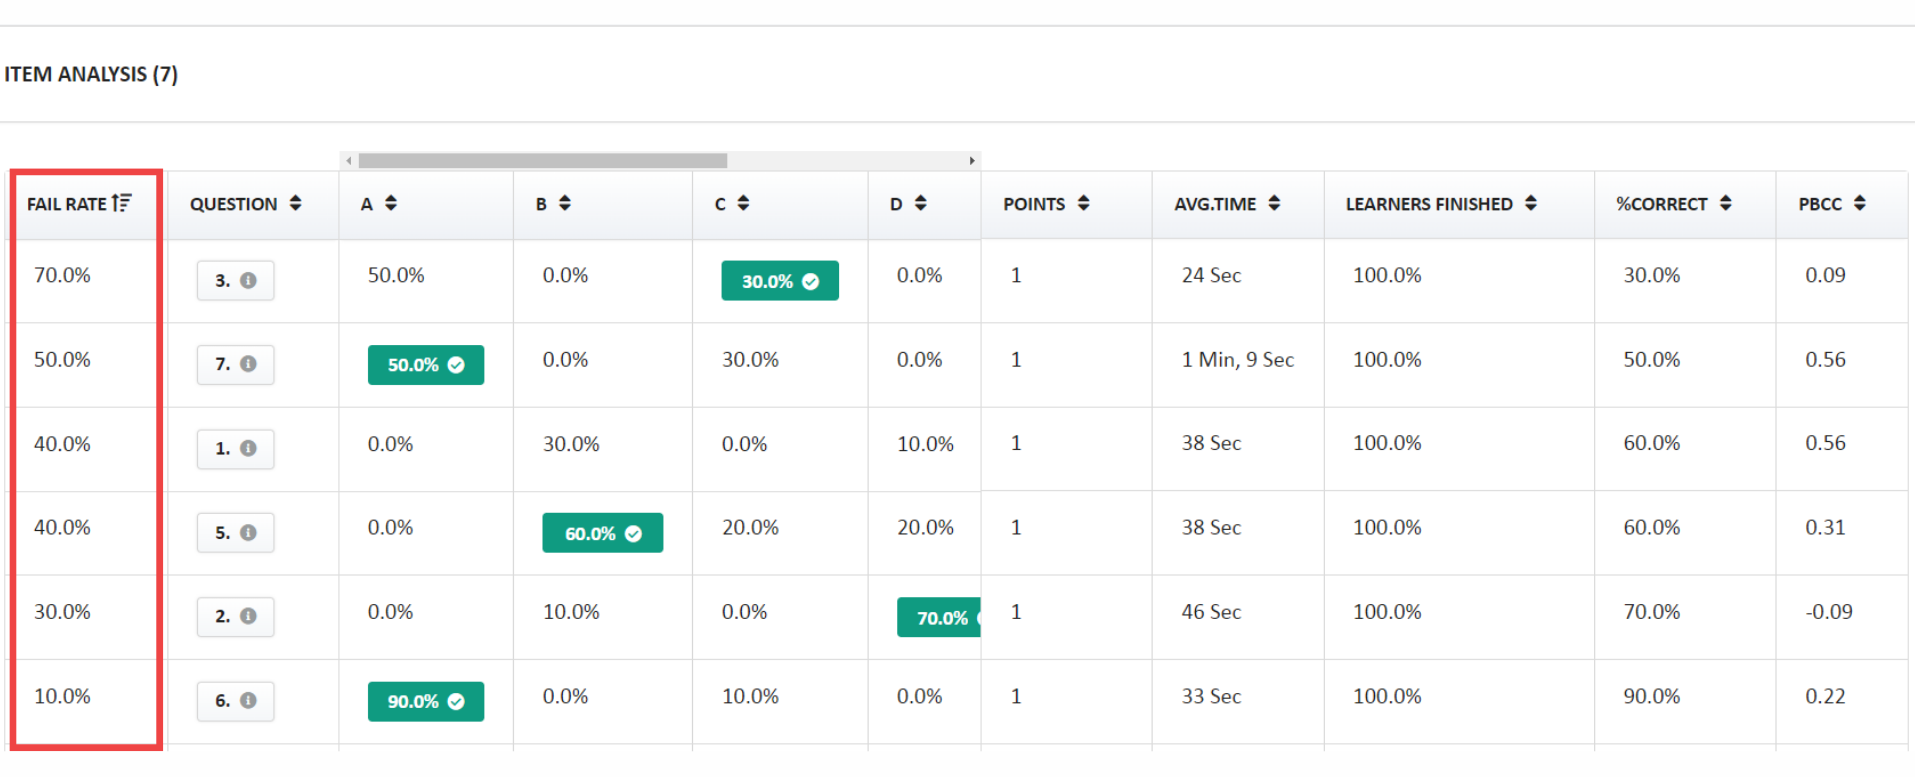
Fail rate refers to the proportion of students answering a question incorrectly. High rates suggest difficulty or ambiguity, leading to poor performance, while low rates may indicate that questions are too easy. Analyzing fail rates helps identify problematic questions for revision or removal in future assessments. - Point-Biserial Correlation Coefficient
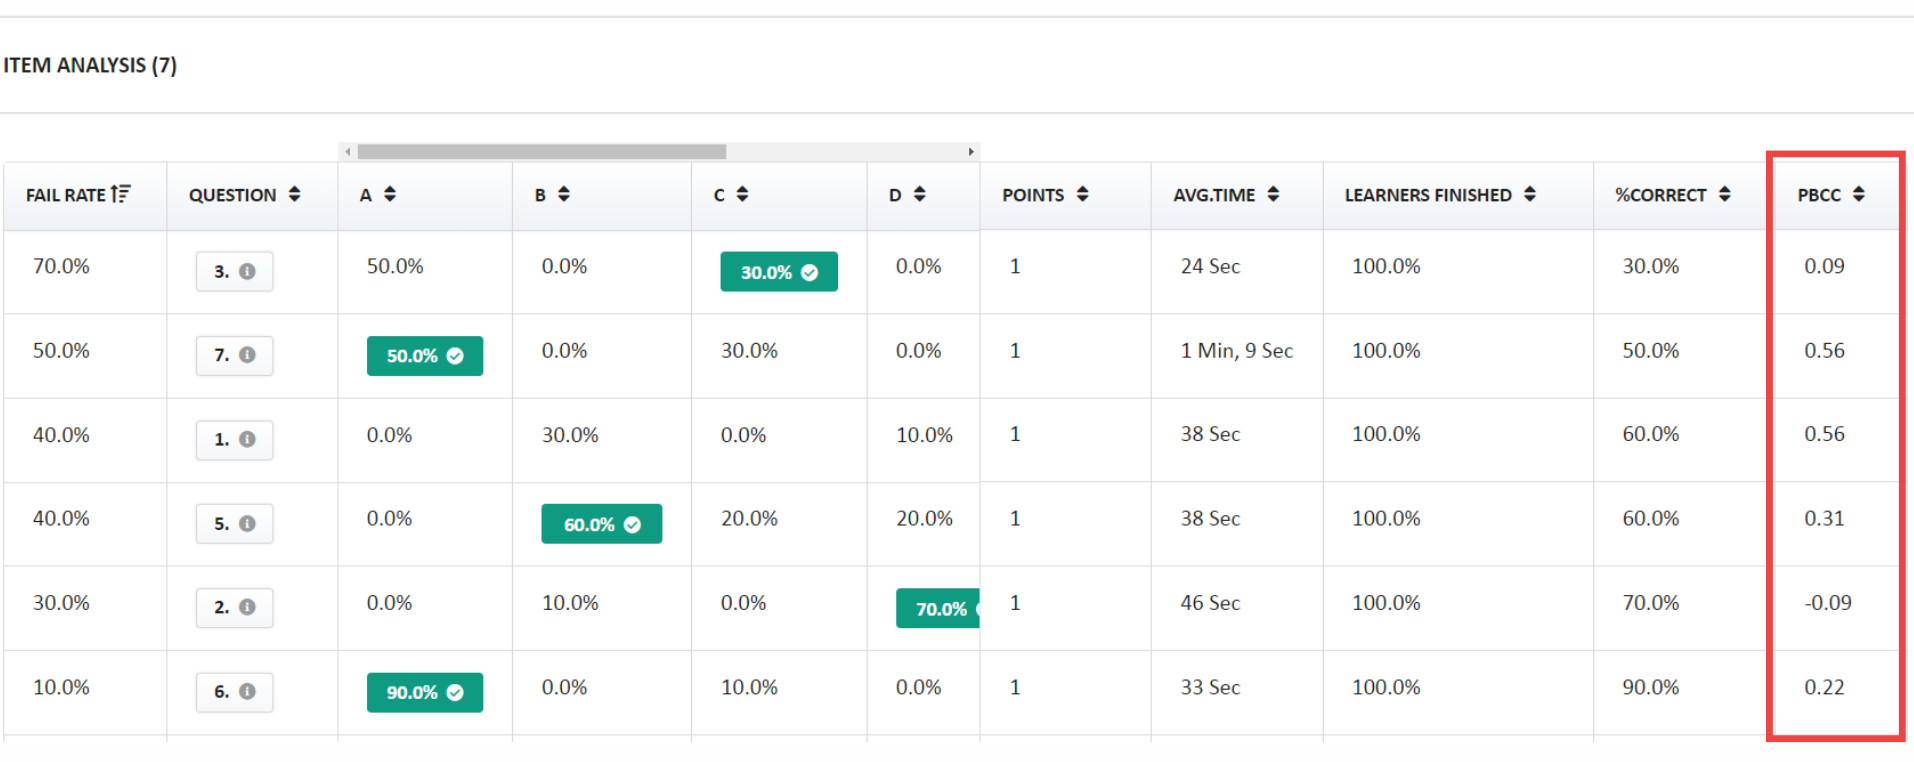
The Point-Biserial Correlation Coefficient (PBCC) is a statistical measure used in item analysis to assess the relationship between individual test items and the overall test scores. It quantifies how well a particular question discriminates between high-performing and low-performing students.
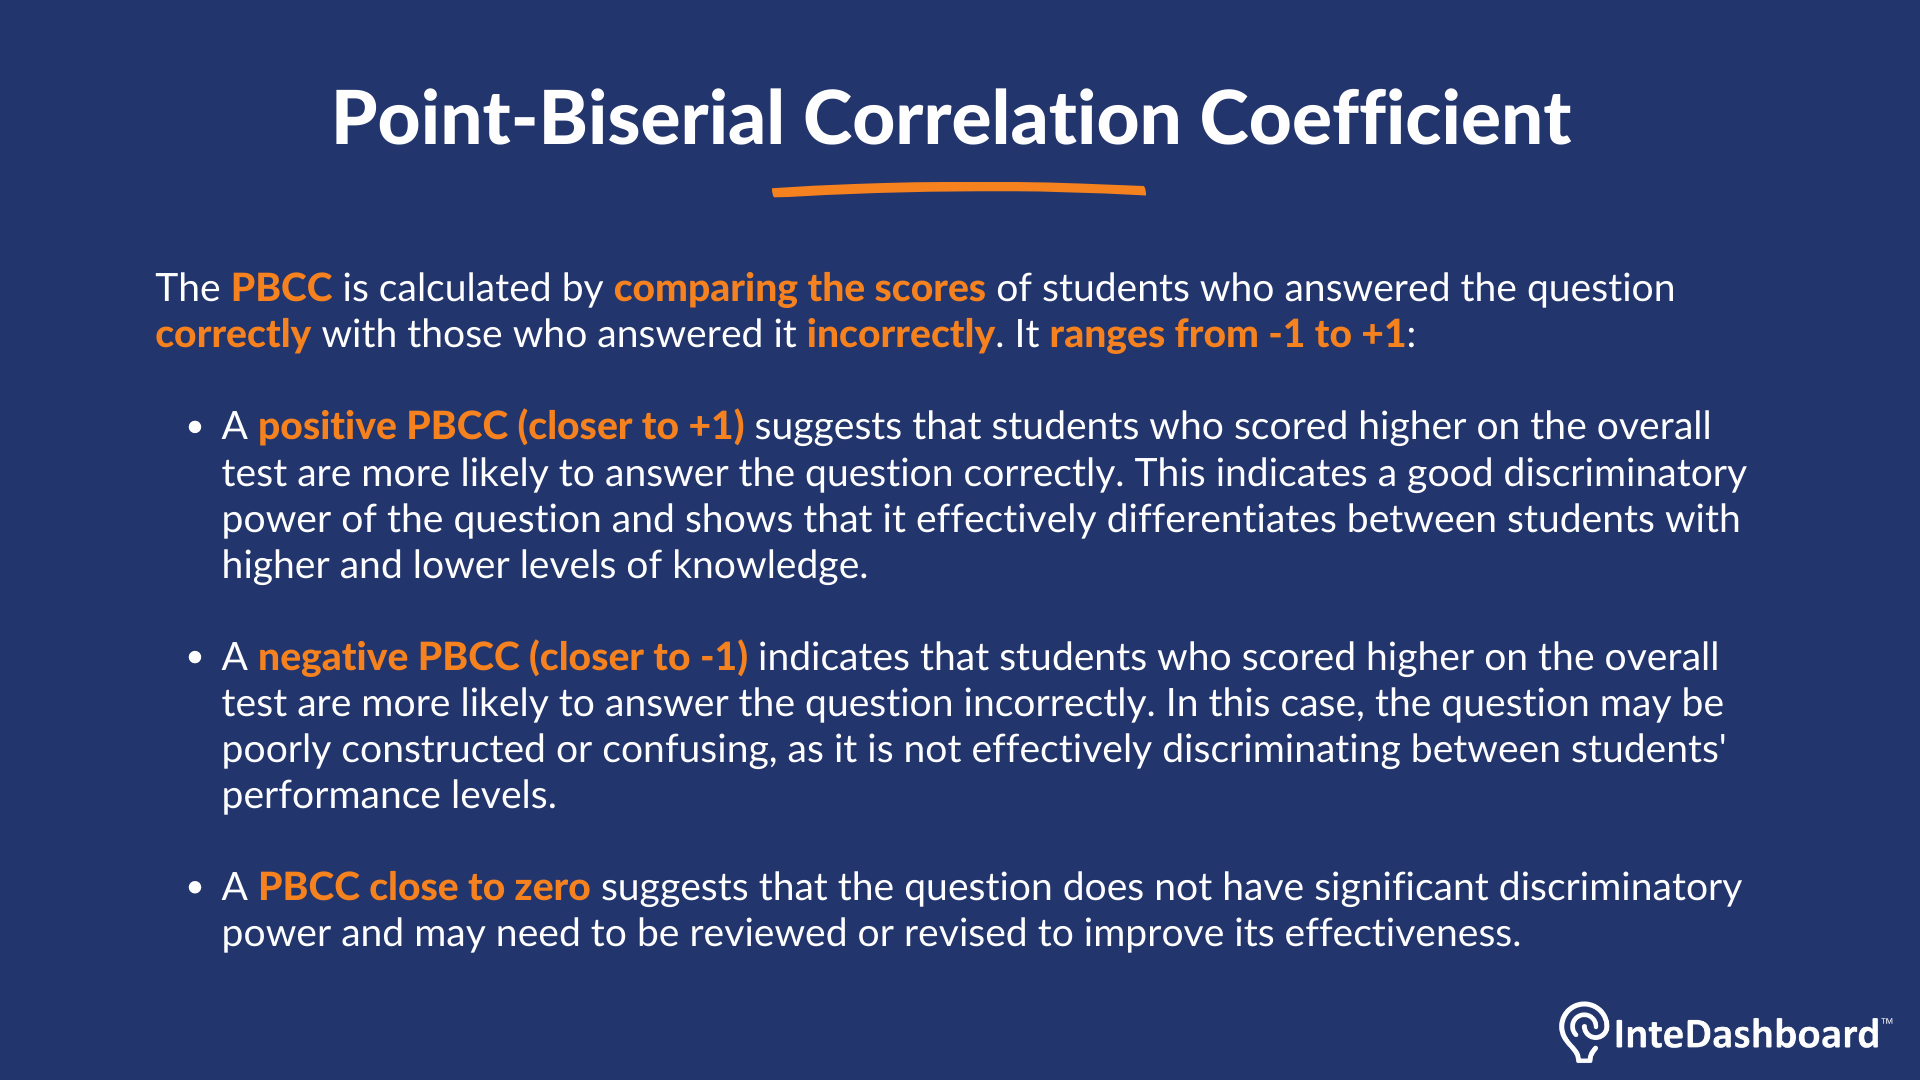
By analyzing the PBCC for each question, educators can identify items that may be problematic and revise the question or provide additional context to enhance its clarity and effectiveness.
Immediate Feedback
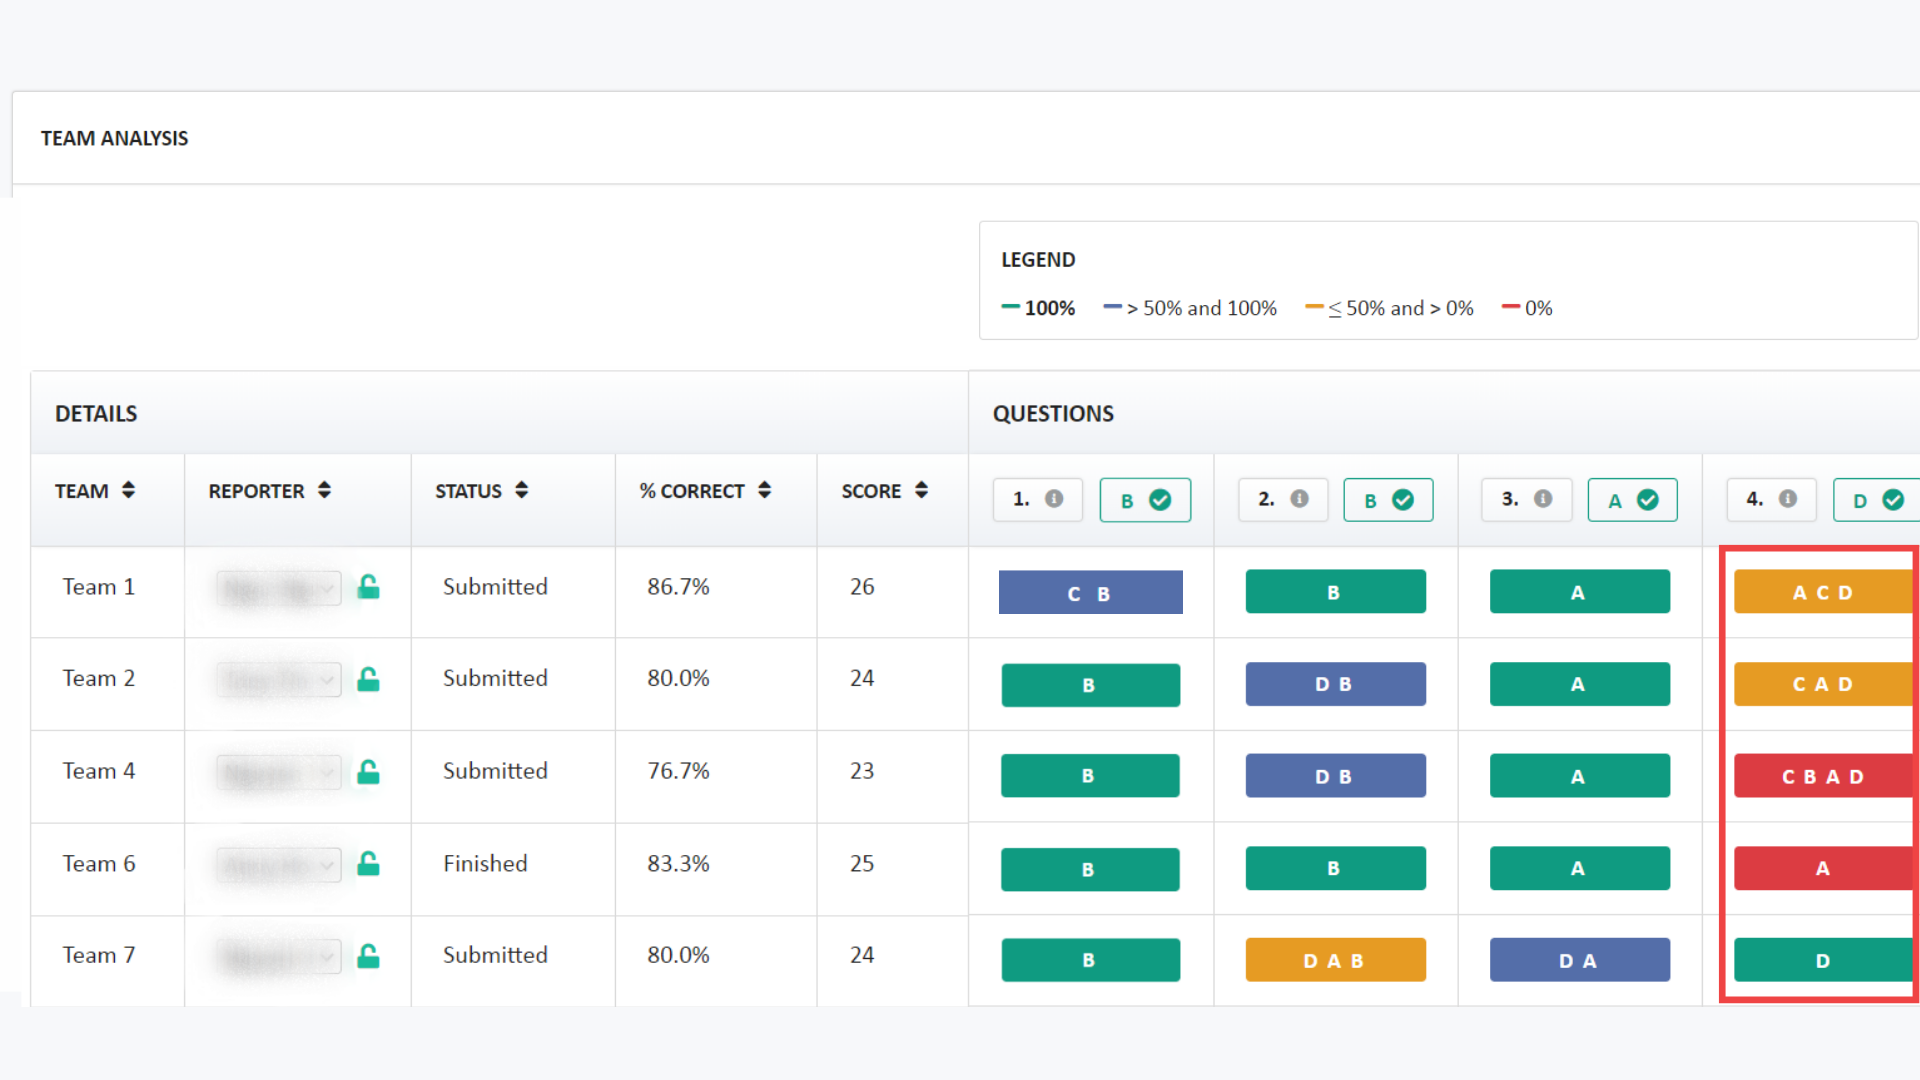
Teacher dashboard of team analysis during Team Readiness Assurance Test
InteDashboard enables instructors to monitor teams' answers and track their progress during the TRAT. Additionally, instructors can view the order in which the teams selected their answer choices. In the red boxed-in part of the image above, it is evident that the first 4 teams provided incorrect answers, with choices A and C being the most popular incorrect choices. Conversely, only 1 team answered correctly. This data allows instructors to clarify and focus on that specific question, addressing any misunderstandings or misconceptions the teams may have. They can use this information to facilitate a targeted discussion, guiding the teams to a better understanding of the topic.
Clarification Request
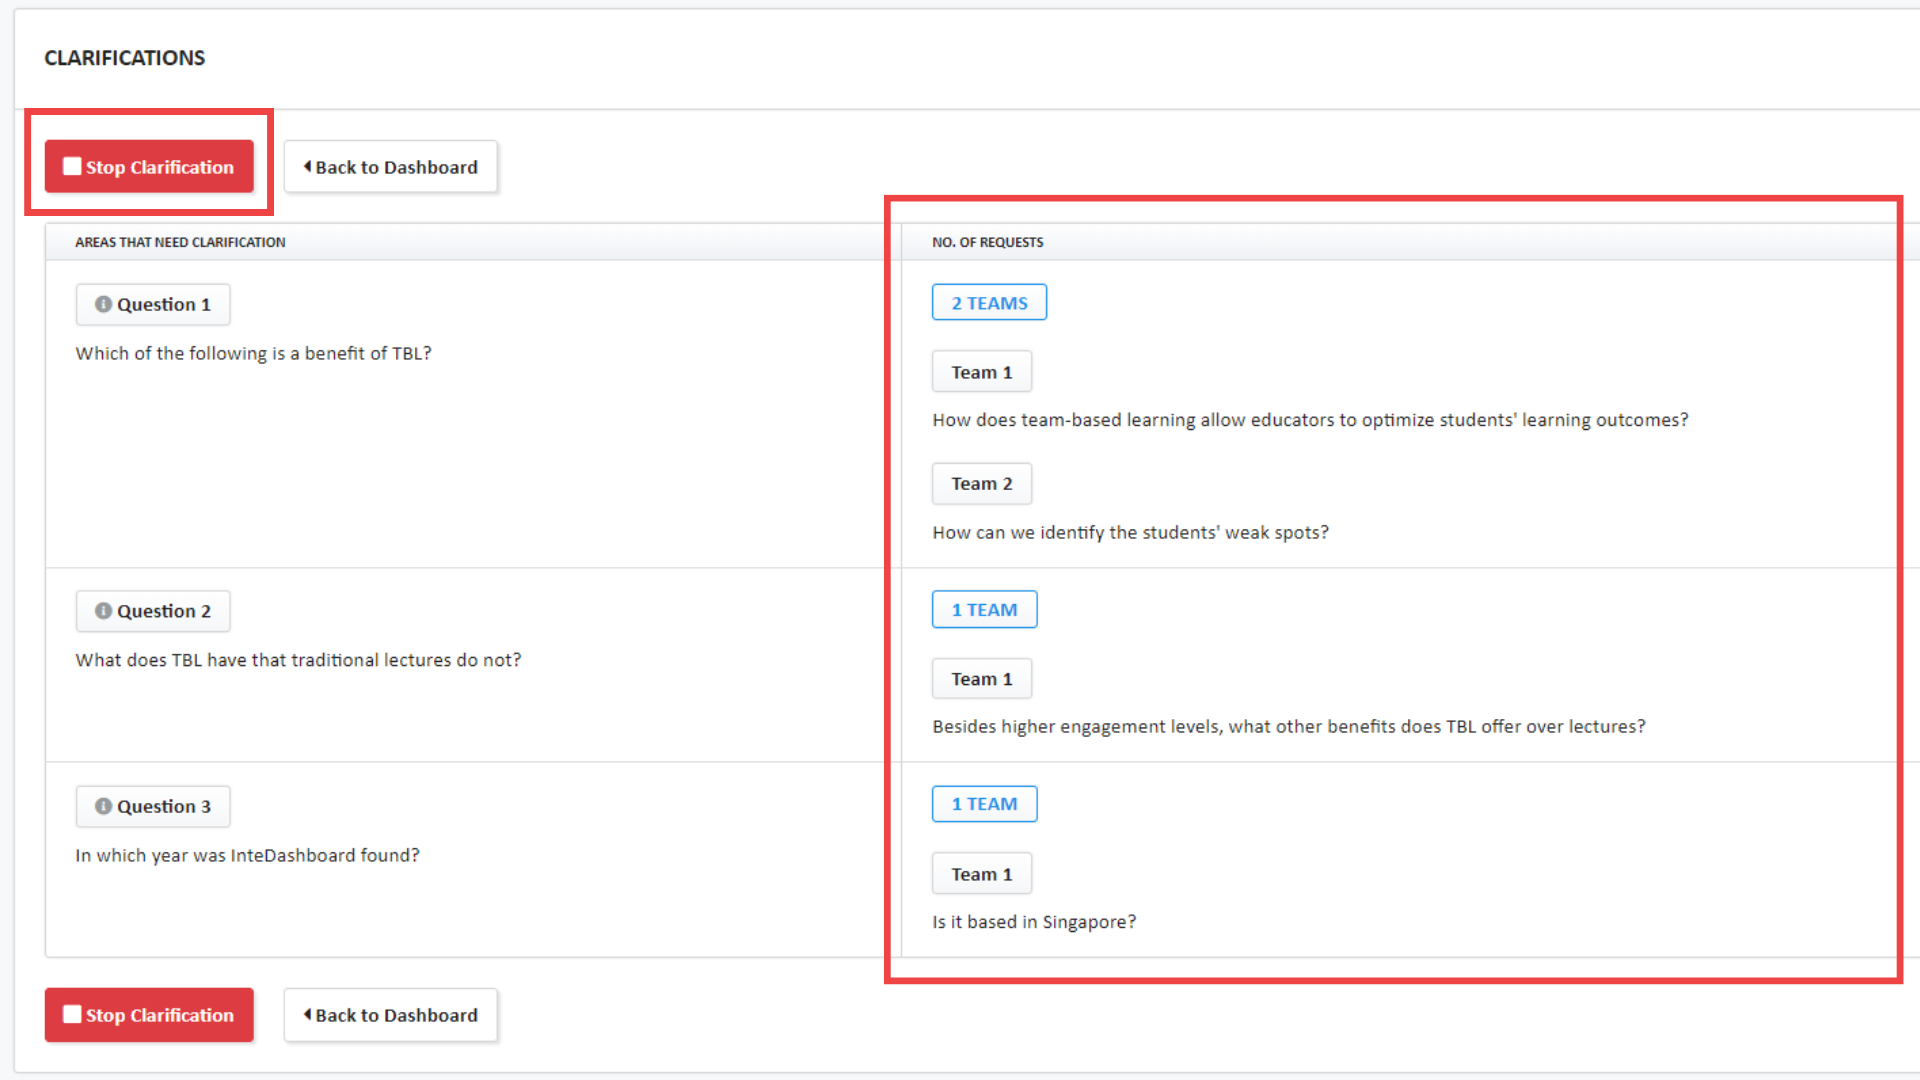
Teacher dashboard of Clarifications requests from students
InteDashboard has a Clarifications feature that allows students to seek clarification on any doubts they may have during the TRAT. In real-time, teachers can receive these clarifications and effectively identify the areas that require attention during the debrief session, enabling them to immediately address these queries and ensure better understanding among students.
Mean, Median, High Low
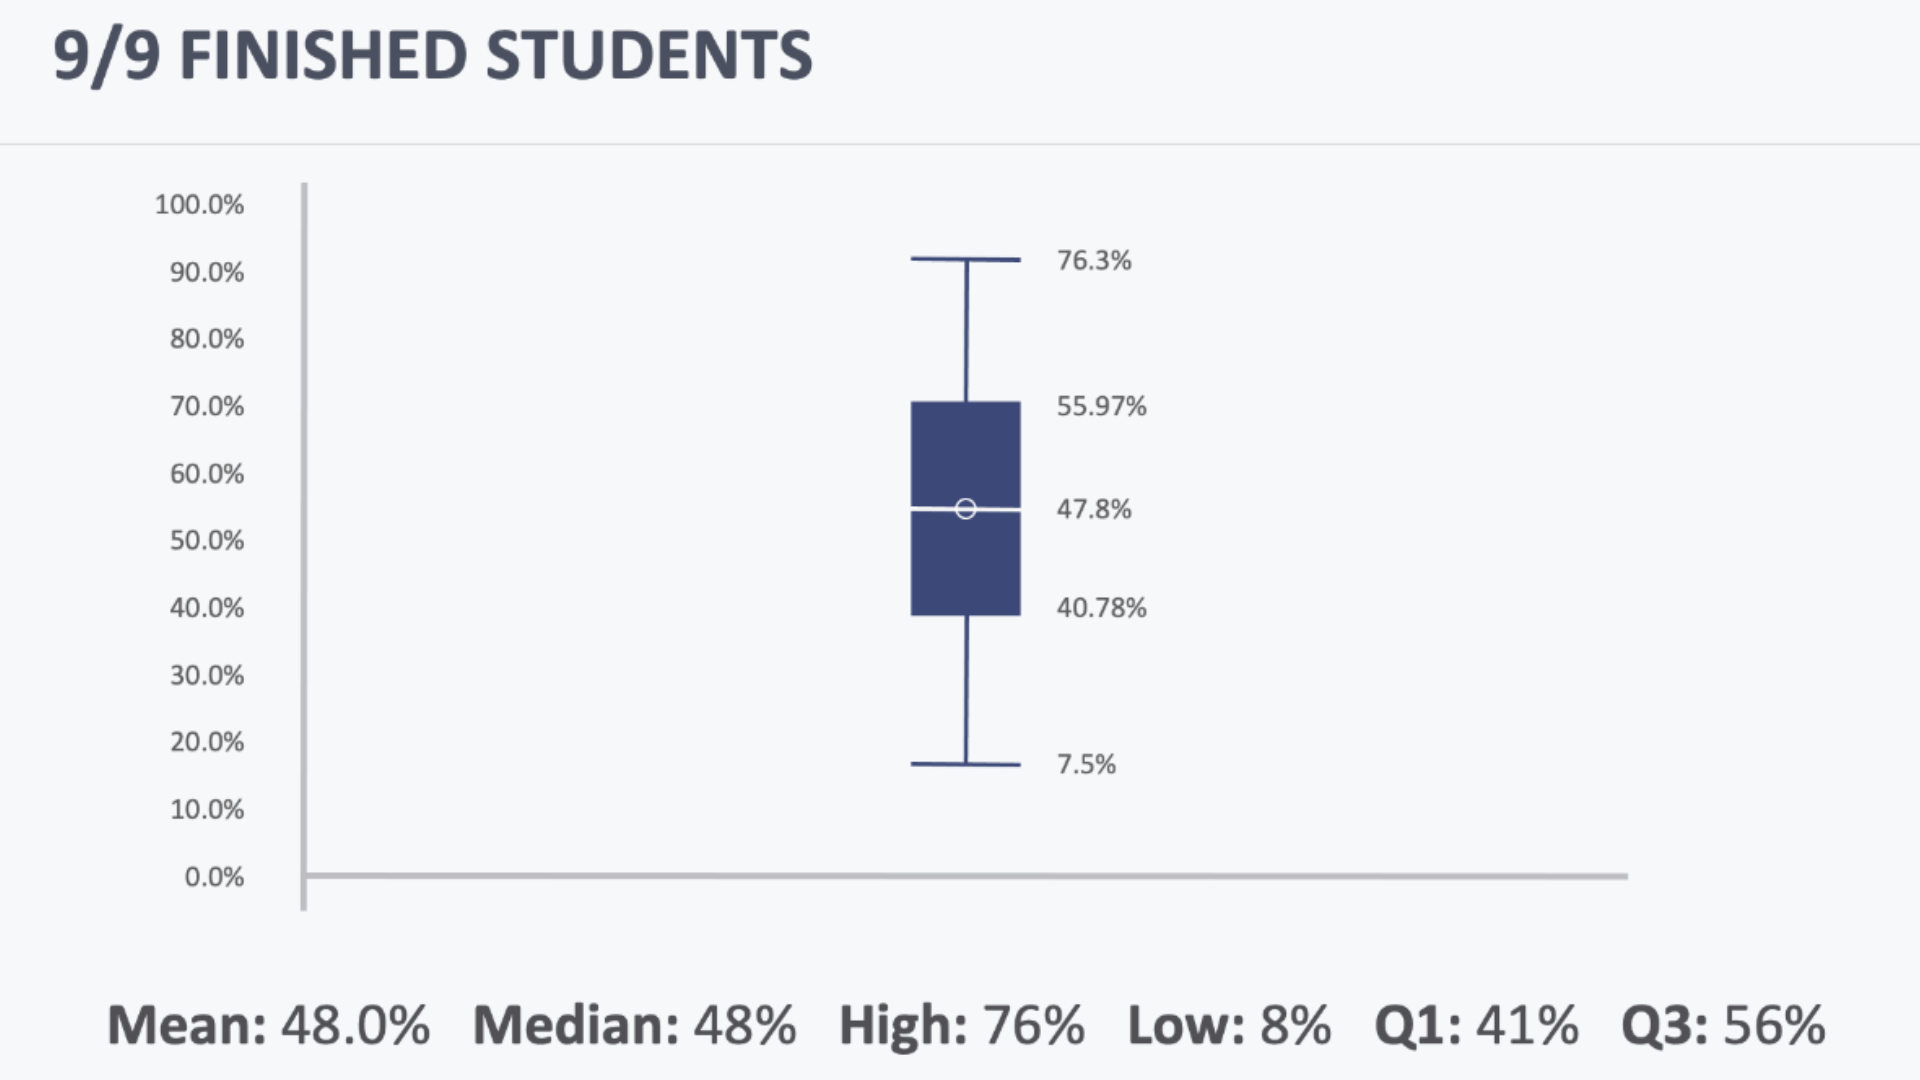
This feature offers real-time visual representation of students' performance on assessments. It displays mean, median, high, and low scores, enabling educators to quickly grasp overall class performance and identify trends in achievement.
Real-time Status and Extend/Deduct Timer
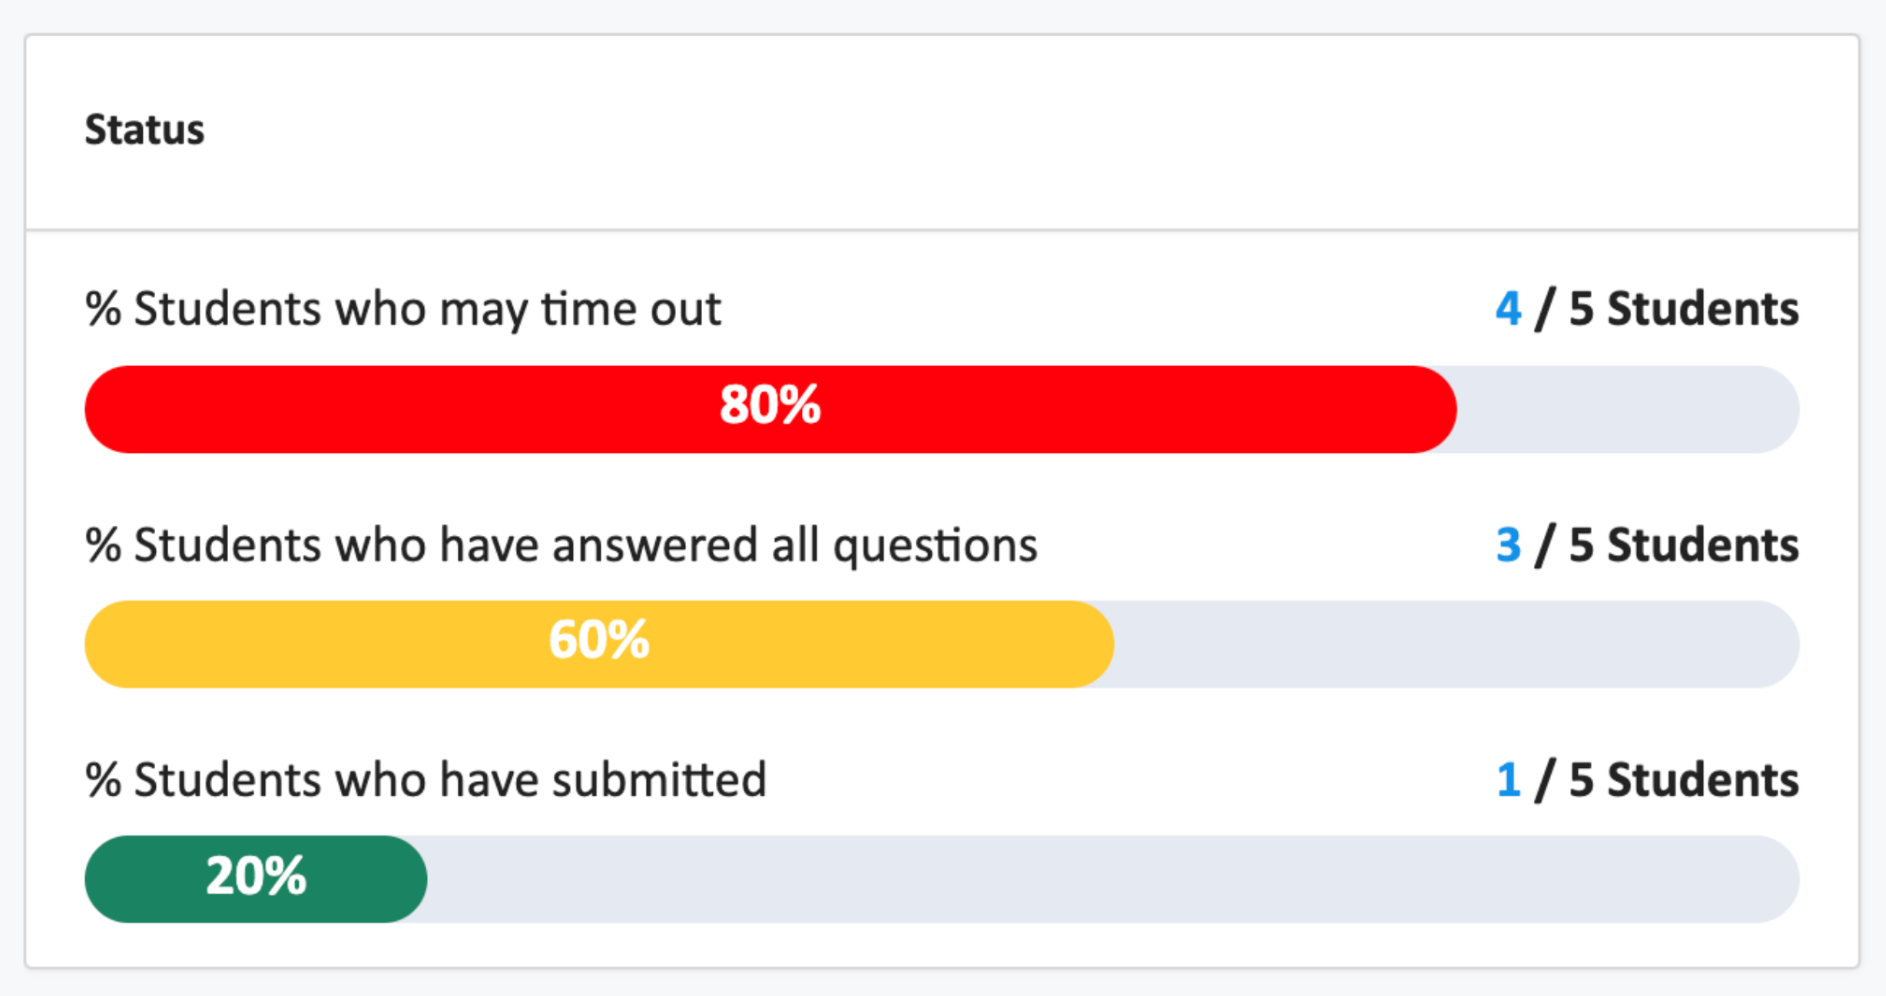
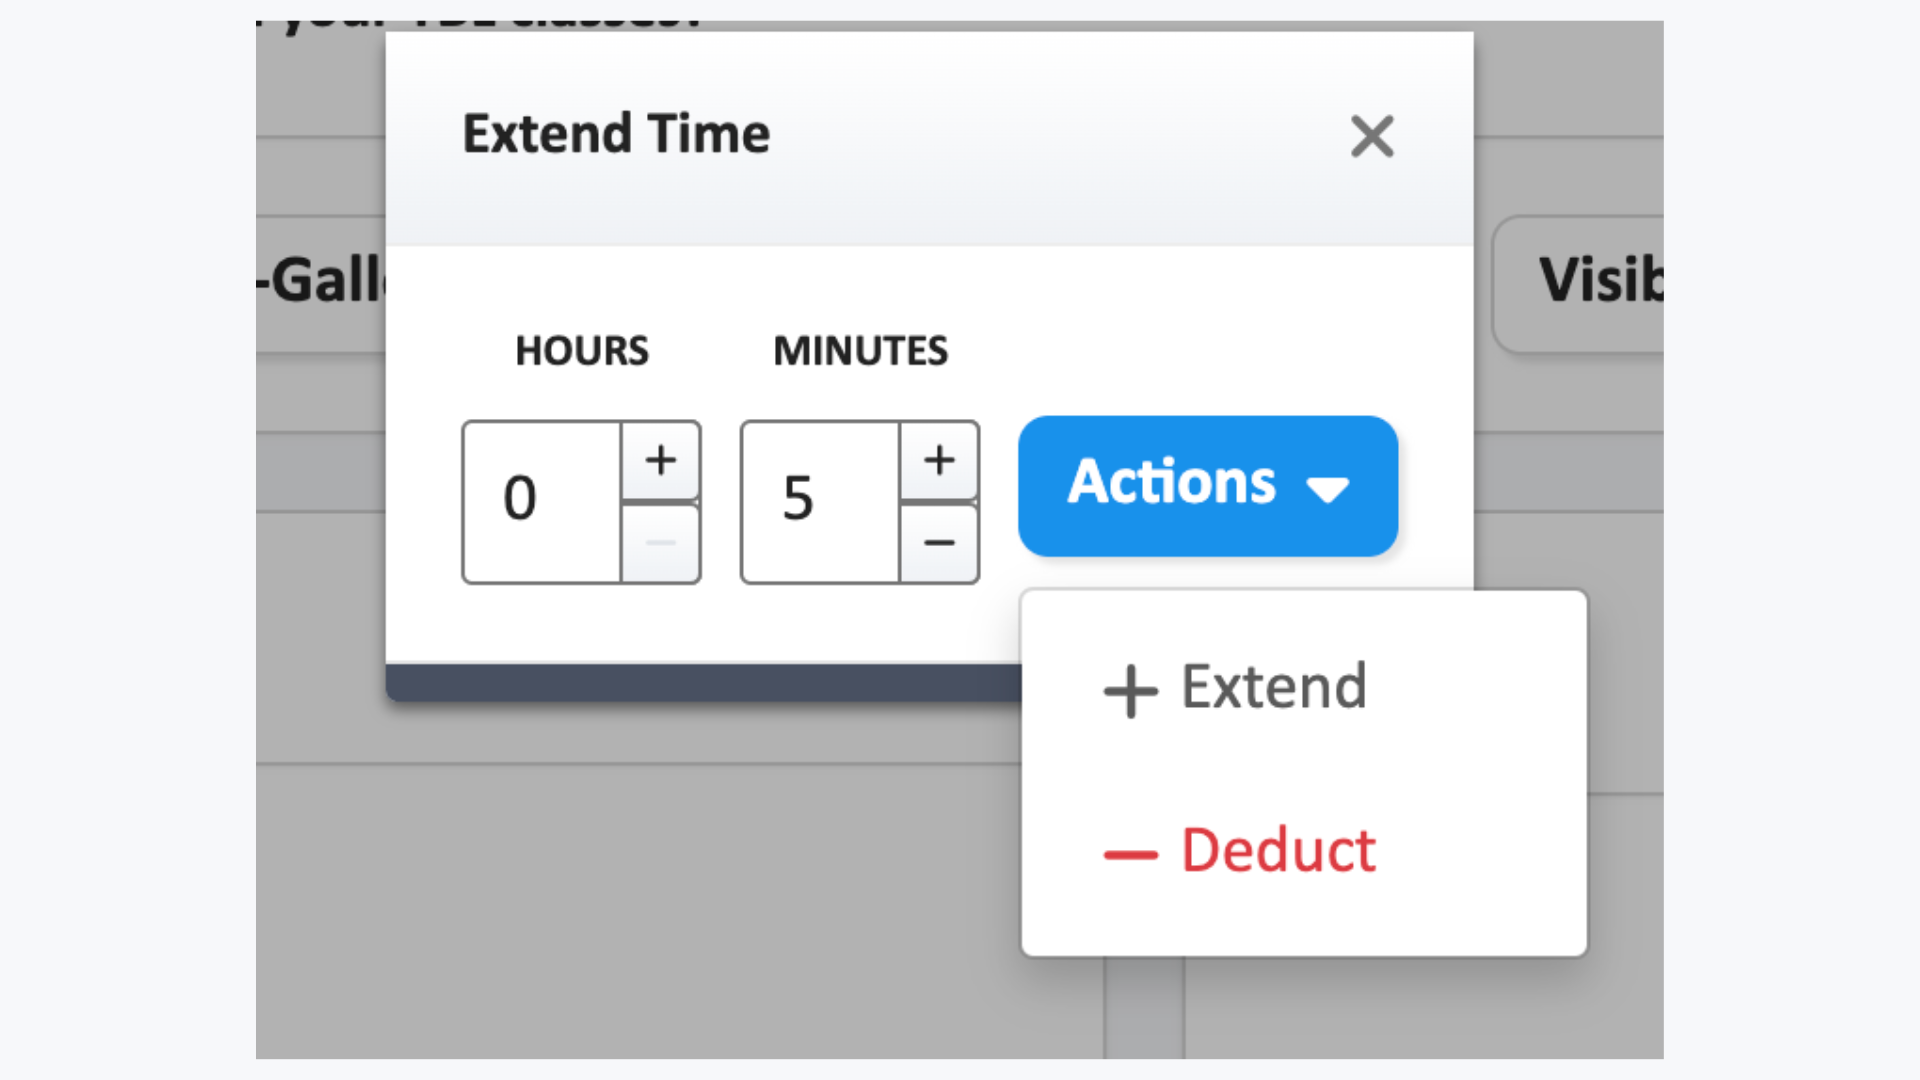
The real-time Status on InteDashboard informs instructors about the percentage of students who have submitted their answers, completed all questions, or are at risk of timing out. This data enables instructors to consider adjustments to the allocated time during the activity, allowing them to extend or deduct time as needed to ensure sufficient response time for all students.
As shown by the mentioned features, InteDashboard is a powerful tool that grants instructors real-time access to students' and teams' performance data. If you're eager to delve deeper into InteDashboard's capabilities, feel free to explore our platform or schedule a one-on-one consultation with us.


.png)


